University lab / Embedded data
Vibration,
sampled & analysed.
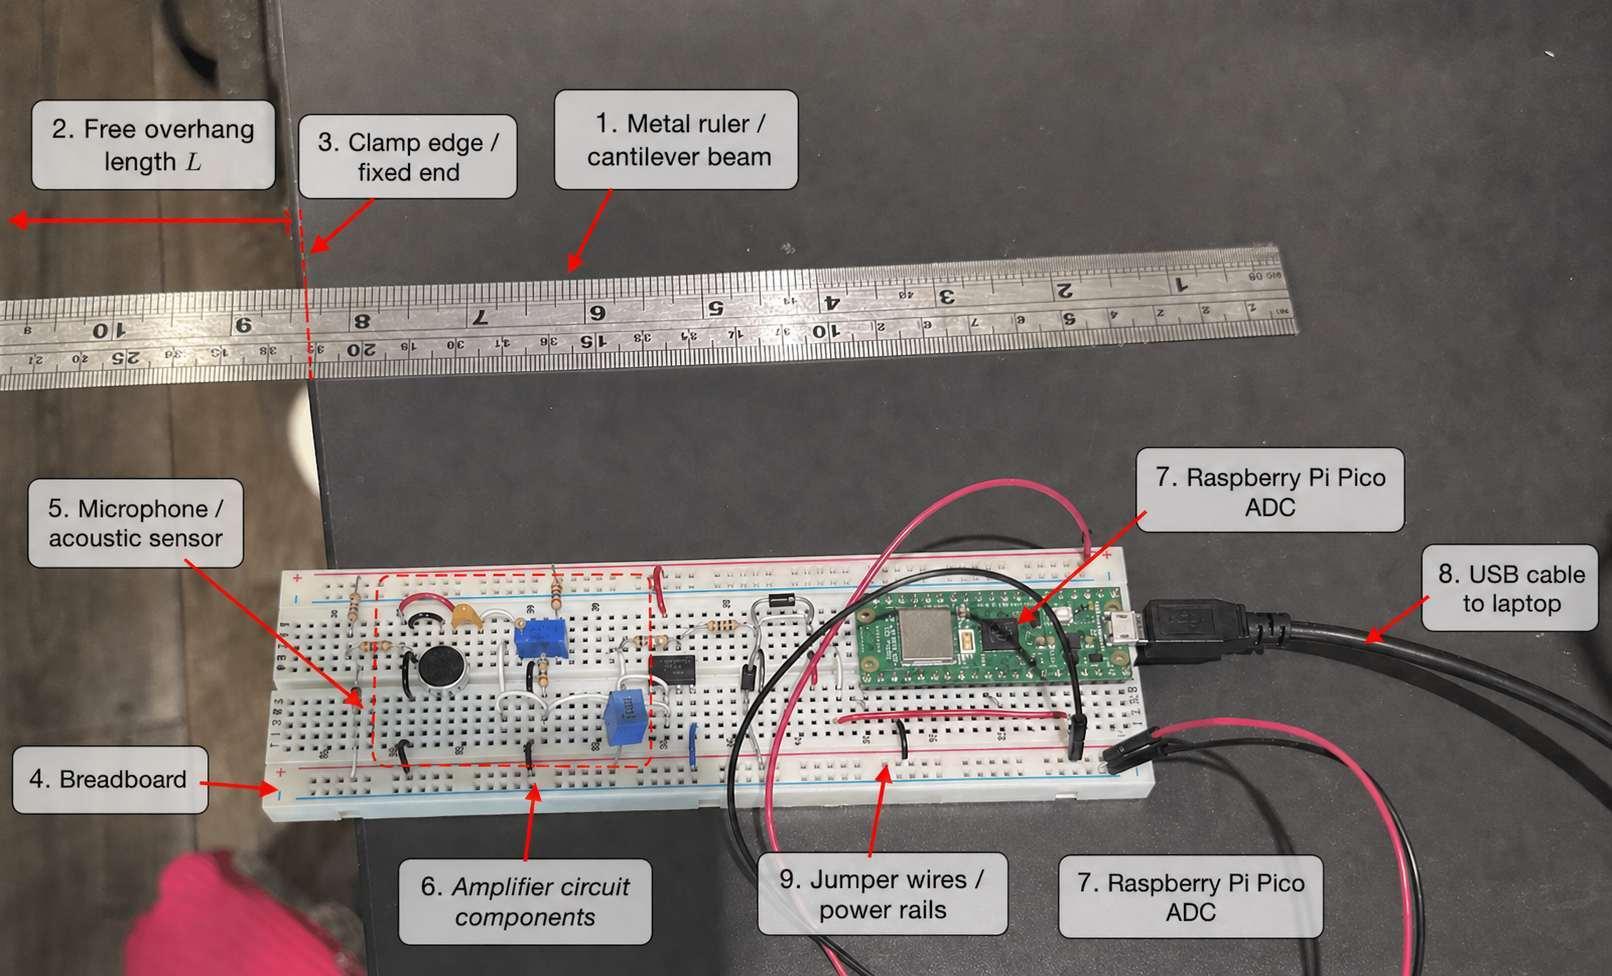
In a Dynamics lab, I used a microphone, amplifier and Raspberry Pi Pico to record a metal ruler's free vibration at 5 kHz. A Python workflow then validated a known tone, extracted vibration frequency, and estimated Young's modulus through a cantilever-beam model.
FREE VIBRATION
Metal ruler fixed as a cantilever
ANALOGUE INPUT
Microphone + amplifier circuit
5 kHz SAMPLING
Raspberry Pi Pico ADC → 3 s CSV
PYTHON ANALYSIS
Crop, zero crossings, frequency and modulus
Workflow
From an acoustic response to a material estimate
Record a repeatable signal
Each 3 s recording captured the release and free decay of a ruler at 0.10 m, 0.15 m and 0.20 m overhangs.
Check the acquisition chain
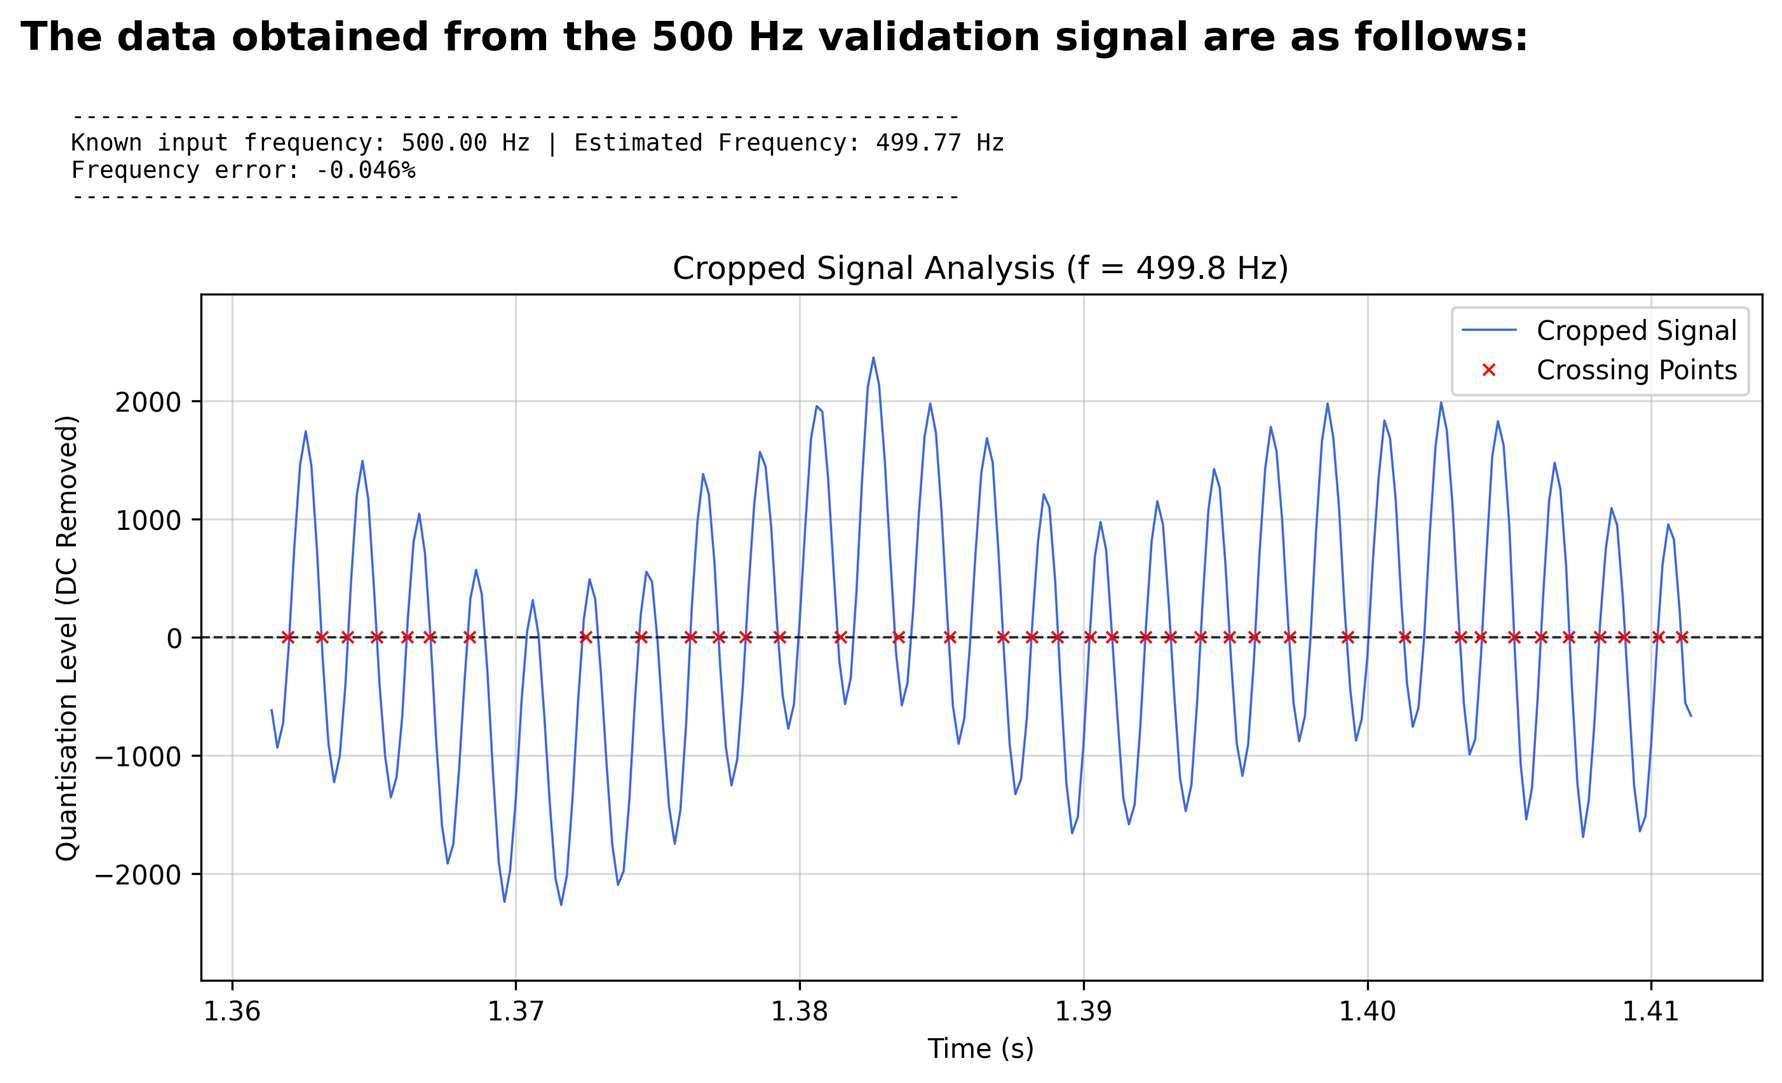
A separate 500 Hz tone was processed with the same settings and returned 499.77 Hz before analysing the ruler trials.
Make the time signal usable
Python removed the DC component, used a moving-average envelope to find the active window, and estimated frequency from zero crossings in the cropped response.
Connect frequency to stiffness
The fundamental frequency entered a cantilever-beam relationship with the measured geometry and mass per unit length to estimate Young's modulus.
Results
Three lengths, nine trials, one evidence trail
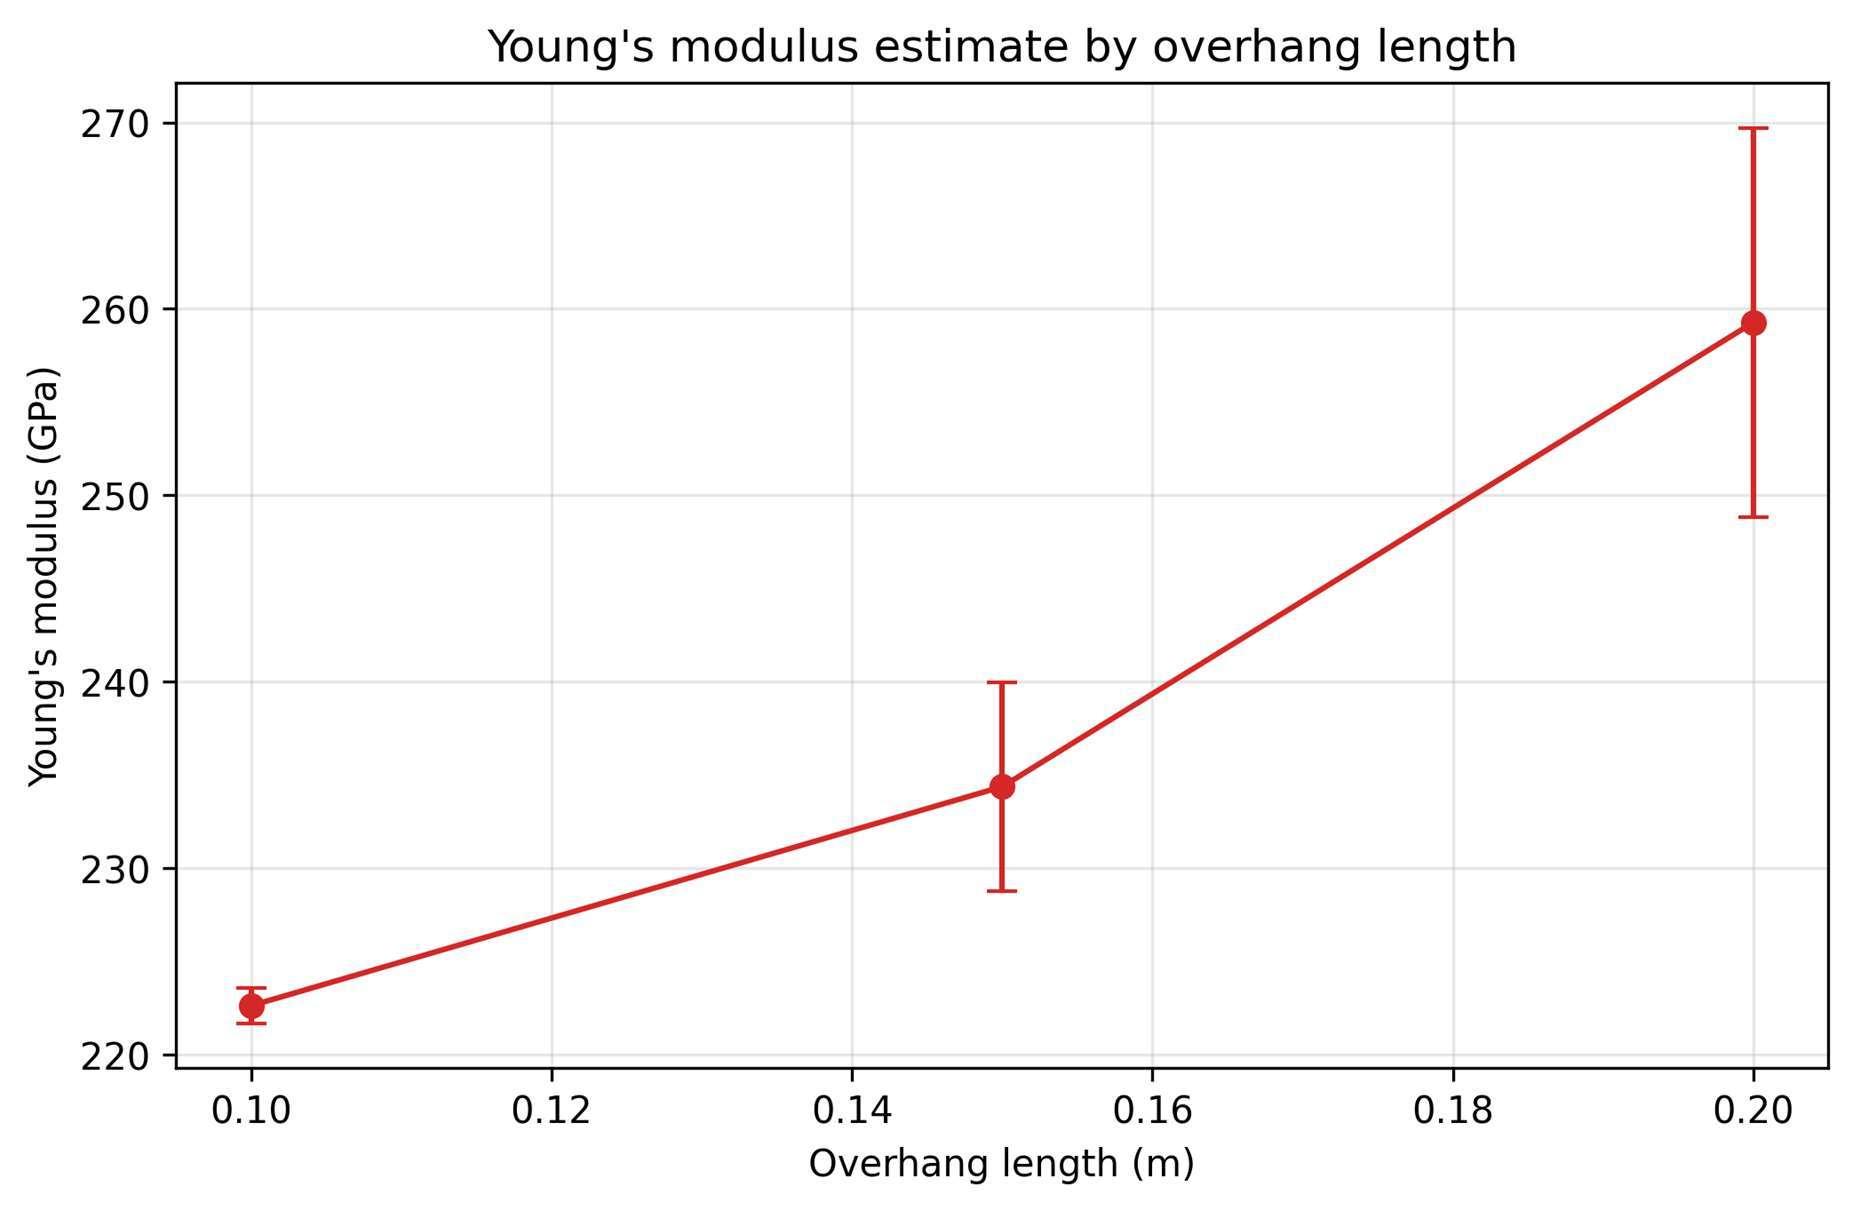
| Overhang | Retained trials | Mean frequency | Frequency SD | Mean Young's modulus |
|---|---|---|---|---|
| 0.10 m | 3 | 53.40 Hz | 0.11 Hz | 222.66 GPa |
| 0.15 m | 3 | 24.35 Hz | 0.29 Hz | 234.38 GPa |
| 0.20 m | 2 / 3 | 14.41 Hz | 0.29 Hz | 259.38 GPa |
What I learned
Embedded sampling is only the start
A physical signal has to survive the hardware
I learned how microphone placement, amplifier gain, ADC sampling and the Nyquist limit affect whether a vibration measurement is useful at all.
Python turns raw CSV into an argument
The useful work was not just calculating a frequency: it was centring the signal, identifying an energetic window, checking crossings, and applying the same method across trials.
Data quality is part of the result
I documented clipped signals, 50 Hz interference and an 8.41 Hz outlier instead of treating every number as equally reliable. That made the final estimate more honest and more useful.
Reflection
Useful measurement, clear limits
The 500 Hz validation showed that the acquisition-and-analysis chain could recover a clean periodic signal. The ruler estimate, however, was sensitive to the real measurement conditions and simple beam assumptions.
Next iteration priorities
- Reduce amplifier gain or increase microphone distance to prevent clipping before it reaches the frequency estimate.
- Improve grounding and shorten wiring to reduce the visible 50 Hz electrical hum.
- Use a stronger clamp and repeated micrometer measurements of thickness, which strongly influences the final modulus.
- Compare the microphone result with an accelerometer or displacement sensor, and add more repeat trials to make outliers easier to identify.
Source note — This page condenses my CADE10002 Dynamics Lab Report. The values and limitations shown here are course-project evidence, presented as an engineering learning project rather than a production-grade material test.